SEA Documentation
sRNA Expression Atlas (SEA) is a web application that allows for the search of known and novel small RNAs across ten organisms using standardized search terms and ontologies. SEA contains re-analyzed sRNA expression information for over 4,200 published samples, including many disease datasets and over 769 novel, high quality predicted miRNAs. In addition, SEA also stores sRNA differential expression, sRNA based classification, pathogenic sRNA signatures from bacteria and viruses, and pathogen differential expression. Furthermore, SEA contains gene targets and diseases associated with a miRNA. These 4,235 samples are systematically annotated with metadata such as standardized information about the organism, cell line, cell type, tissue type, potential diseases and more. Additional annotations include experimental details about instrument models and library strategies. The raw data from all datasets were analysed with the Oasis 2 pipelines to achieve comparable small RNA expression across many studies. In summary, SEA supports interactive result visualization on all levels, from the querying and displaying of sRNA expression information to the mapping and quality information for each sample.
About small RNAs
Small RNAs
Small RNAs (sRNAs) are a class of short, non-coding RNAs with important biological functions
in nearly all aspects of organismal development regarding health and disease.
sRNAs are the type of ncRNAs with length less than 200 nucleotides (nt).
Based on their biogenesis and biological functions the major types of sRNAs include:
micro-RNA (miRNA), PIWI-interacting RNAs (piRNAs),
small interfering RNA (siRNAs),
small nuclear RNAs (snRNAs) and small nucleolar RNAs (snoRNAs).
MicroRNAs
MicroRNAs (miRNAs) are around 22 nt in length and play an important role in gene regulation
by targeting messenger RNA (mRNA) for cleavage or translational repression.
miRNAs are the most abundant class of sRNAs and they affect the regulation of
many protein-coding genes.
PIWI-interacting RNAs
PIWI-interacting RNAs (piRNAs) are small (around 24-32 nt long) noncoding RNAs
mostly expressed in the germline. PIWI proteins protect and maintain genomic stability in germline cells
by binding to invasive transposable elements (transposons).
Small nucleolar RNAs
Small nucleolar RNA (snoRNA) is a class of sRNA, usually 60-150 nt long,
responsible for the post-transcriptional modification of ribosomal RNAs (rRNAs).
snoRNAs are a part of the small nucleolar ribonucleoproteins
(snoRNPs), protein complexes which play a role in the pseudouridylation,
and also in the sequence-specific 2’-O-methylation of the rRNA.
Small interfering RNA
Small interfering RNA (siRNAs) are around 20-25 nt double-stranded RNA molecules that can target
mRNAs based on perfect complementarity. The RNA interference (RNAi)
silencing complex uses the antisense strand of the siRNA for mRNA
cleavage and hence promotes mRNA degradation.
Small nuclear RNAs
Small nuclear RNAs (snRNAs) are mostly found in eukaryotic cells and are also called as U-RNA.
snRNAs are known to have an important role in the splicing of introns
from primary genomic transcripts. The average length of snRNA is around 150 nt. Each snRNA
has an association with a set of proteins called as ribonucleoproteins.
The complex of snRNA and ribonucleoproteins is refered to as
small nuclear ribonucleoproteins (snRNP or snurps). Prominent components of these snRNA complexes are
spliceosomal RNA such as U1, U2, U4, U5 and U6, that plays a major role in the maturation of the eukaryotic precursor messenger RNA.

Search Options
SEA can be searched for:
- sRNAs originating from miRBase, Ensembl as well as from the repository of novel predicted miRNAs from Oasis,
- Datasets based on ontology-linked metadata,
- pathogenic
- sRNA signatures from bacteria and viruses,
- gene targets
- diseases associated with a miRNA,
- miRNA associated with diseases,
- What is expression of one or more sRNAs/pathogens in specific cell types or tissues?
- Is a particular sRNA/pathogen differentially expressed in a disease e.g alzheimer’s disease?
- How do sRNAs across different studies (tissues, disease, cell types or cell line) compare?
- What are differentially expressed sRNAs in breast cancer and healthy women?
- What are common differentially expressed sRNAs or potential sRNA-based biomarkers across a particular disease or tissue?
- How are one or more novel miRNAs experessed for known diseased states?
- What are all gene targets for a given miRNA?
- What are all the diseases associated with a miRNA from the published literature?
- Whta are all the miRNAs associated with a disease or its sub-types?
- What are the genomic coordinates for a sRNA or its target genes?
All searches for experiments or pathogen(s)/sRNA(s) start by using the search bar on the top of SEA web pages. Search suggestions will autocomplete when typing in the search bar. The adjacent figure (Fig 2) shows what it looks like when the partial entry "human her" is entered into the search bar. Note that this autocomplete functionality restricts pasting to the search bar to one term at a time. SEA's search bar will show suggestions across all categories. Currently, the following search categories are supported: sRNA ID, Pathogen, Organism, Cell type, Tissue, Cell line, Disease, and Dataset

Please note that SEA only allows searches based on suggested terms. And all terms that are suggested (while typing) are guaranteed to be in the database. If you are looking for a specific disease/tissue/organism/etc. and no matching terms are suggested, then there is no dataset with your criteria in the database.
Combining several search terms
When using several search terms, datasets are found according to the following rules:
- If there are several search terms with the same category (e.g. several different diseases), at least one search term is matching.
- If there are several search terms with different search categories (sRNA ID, pathogen name, disease, tissue, cell type, ...), all search criteria have to be met.
- The combination of the first two points leads to datasets for which at least one search term of EACH search category is true.
Searching with ontologies
Each experiment in the SEA database is annotated with ontological terms. On can think of an ontology as a list of relationships between words. For example, if we take the words "human" and "mammal", we can say that a human is a mammal. Not only humans are mammals, but mice, dogs, dolphins and pigs are mammals too. Taking this futher, all mammals are also vertebrates, all vertebrates are chordates, etc. Ontologies are not restricted to organisms. Many more ontologies have been defined by independent organisations. When using SEA's search all datasets will be found that match the search term, as well as all subterms as defined in these ontologies. For example, the query "neurodegenerative disease", will yield results from Alzheimer's and Huntington's disease. Likewise, the search query "murinae" will provide datasets from both mice and rats. SEA's ontological search enables flexible specificity, be it broad or fine-grain, allowing users to search as they wish.
Search Results
When working with SEA, users will most likely find themselves:
- interested in a specific sRNA/pathogen (entity) and wanting to obtain expression datasets which contain this entity.
- interested in a specific tissue/disease/cell-line and the sRNAs that are differentially expressed or used in classification (healthy vs disease patients or tissue) in this tissue/disease/cell-line.
- researching a sRNA and a tissue/disease/cell-line and looking for datasets which feature this sRNA in this particular tissue/disease/cell-line.
 All tables in SEA, have columns that are sortable with Timsort.
Click the header of a column to sort and unselect from
the column from the Timsort list. (Example in Dataset Figure)
Also, tables can be filtered by terms appearing in any column of the table.
(Example in Disease Associations Figure). Most tables are downloadable as tab-seperated file from
the download link at the buttom right of the displayed table.
Please choose your starting point:
All tables in SEA, have columns that are sortable with Timsort.
Click the header of a column to sort and unselect from
the column from the Timsort list. (Example in Dataset Figure)
Also, tables can be filtered by terms appearing in any column of the table.
(Example in Disease Associations Figure). Most tables are downloadable as tab-seperated file from
the download link at the buttom right of the displayed table.
Please choose your starting point:
- Search by sRNA(s)/pathogen(s)
- Search by sRNA(s)/pathogen(s) along with any terms (tissue, disease, cell type, cell line)
- Search only by metadata terms and their combination
- Search by sRNA(s)/pathogen(s)
Searching for one or more sRNAs/pathogens, SEA will present the following results :
- Expression values
- Datasets
- Differential expression sRNA specific output:
- Classification analysis
- Targets
- Disease associations
- Chromosome locations
- Expression values
The first section shows the expression of the requested sRNA/pathogen in all experiments in the
form of a violin plot.
The violins can be clicked to investigate the expression profiles in a
particular experiment (dataset). The results of the clicked violin show a table
with the expression of the selected sRNA or pathogen in each sample, as well as the metadata for all samples
such as the sample id, tissue, disease, cell type, experimental process, extracted molecule, etc.
Here one also finds the analysis results for the raw sequencing data from Oasis.

Fig 3: Violin plots are shown for the expression of hsa-miR-133a-3p across datasets with muscle annotation. The violin plots show distribution of the reads per million (RPM) values for the requested sRNA in the samples, which belong to current selection annotation (tissue in this case). For example the top violin muscle-GSE66334 shows the expression of 12 samples from the dataset. Zero expression values are excluded in the plots. The violins can be subset by organism and sorted by different metrices such as max RPM, median RPM, mean RPM, number of samples, name and dataset id. Hovering on the violins summarizes the information in a tooltip. Clicking on a violin will navigates the user to an overview of all the samples with the expression of the queried sRNA in the dataset along with the corresponding metadata such as tissue, cell-type, cell line, disease and more annotations. Moreover raw sequencing data analysis output from Oasis is provided here. In the case that no ontological term such as tissue, cell-type, cell line or disease is queried with sRNA, tissue annotation is shown by default for violins and the user can change the labels from the dropdown menu. In the case a dataset contains samples from different tissues (or selected annotation, respectively) it will appear several times, i.e. a violin for each set of samples will be shown. Note: The same holds true for pathogen search.

Fig 4: If the search contains two or more entities (sRNA or pathogens), a violinplot is shown with distinct colors per sRNA or pathogen in the same panel.
- Datasets
The table of experiments (datasets) that have samples with expression of the searched sRNA(s) or pathogen(s)
displays metadata such as the number of samples in the experiment, tissue, cell line, organism disease,
cell type, as well as a link to the Oasis 2 output (analysis results of the raw sequencing data with detailed quality information).
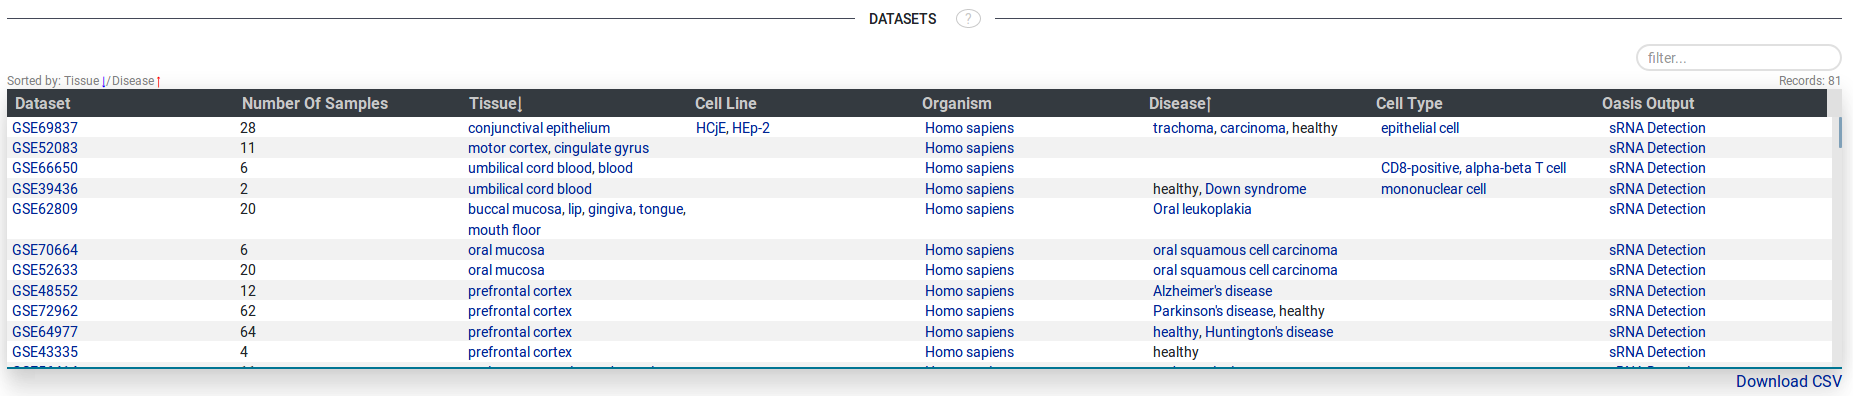
Fig 5.
- Differential Expression
This section shows two tables with differential expression values (the log2 fold change and the p-adjusted value) in
comparisons (within experiment) for the searched sRNA(s) or pathogen(s).
The first table shows all comparisons that the user uploaded. The second table
shows all comparisons within public experiments where the searched sRNA(s) or pathogen(s)
are differentially expressed.
The tables also show the condition on which this differential expression analysis was performed such as healthy vs diseased,
the covariates (if any) and a link to the details page. Clicking the link to the details page
yields a t-SNE plot. For sRNA the
analysis results of differential expression performed with Oasis 2, which has all the diagnostic plots, is also provided.
For pathogens, this linked details page displays the analysis results of an in-house pipeline in table format.
The details page is explained more in depth in section analysis.

- Classification analysis
This section shows two tables with the mean decrease gini
score in comparisons (within experiment) for the searched sRNA.
The first table shows all comparisons that the user uploaded. The second table
shows all comparisons within public experiments where the searched for
sRNA(s) are used as an important feature
when classifying two conditions (e.g healthy vs disease).
The table also shows the condition on which this classification analysis was performed such as healthy vs diseased,
AUC (for the whole model), and a link to a details page. Clicking the link to the details page
yields a t-SNE plot and analysis results of classification analysis performed with Oasis2, which shows all the diagnostic plots) as well as
options for downstream enrichment analysis.
The details page is explained more in depth in section analysis.

Fig 7.
- Targets The targets table shows all the targets associated with a sRNA (only applicable if the sRNA is a micro RNA). The table shows gene names, ENSEMBL gene ids, and associations (publications from where this relation was obtained). All of these values are clickable links corresponding to relevant sources such as genecards and pubmed. Tabs are shown for each miRNA in case of multiple miRNAs.
- Disease associations
The disease association table shows all the diseases associated with a sRNA (only applicable if the sRNA is a micro RNA). The table shows disease names and associations (publications from where this relation was obtained). All of these values are clickable links corresponding to their sources like the ontology lookup service (OLS) and pubmed. Tabs are shown for each miRNA in case of multiple miRNAs.
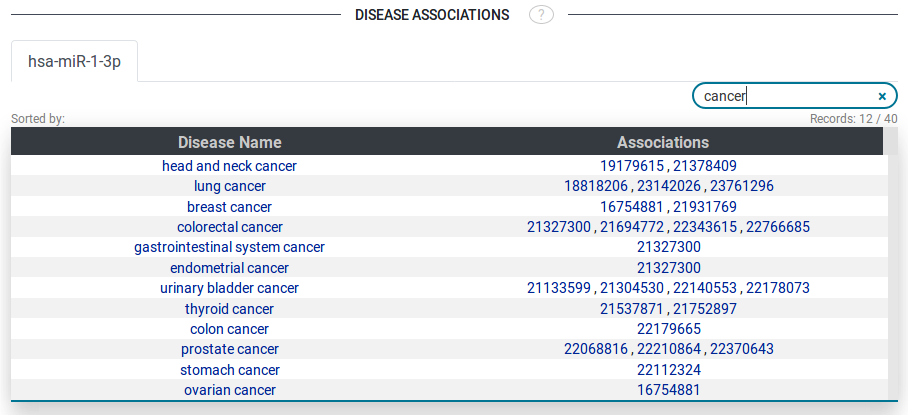
Fig 8.
- Chromosome locations Genomic coordinates for the searched sRNA(s) such as sRNA-ID, biotype ( miRNA, snoRNA, piRNA, siRNA etc), chromosome, start, end, strand, and organism are shown in this section. Tabs are shown for each sRNA in case of multiple miRNAs.
Fig 6.

Fig 9.
- Search by sRNA(s)/pathogen(s) along with any terms (tissue, disease, cell type, cell line) When one searches for one or more sRNAs/pathogens along with a term such as tissue, disease, cell type, cell line etc, the results are shown exactly the same as explained in section 1, except that the datasets are already filtered for the term. Also, the expression plots will be labeled with the terms of the same category of the search term e.g. looking for cancer datasets results in an expression plot (violin plot or heatmap) with disease labels.
- Search only by metadata terms and their combination
In case you search for one or more terms such as
tissue, disease, cell type, cell line,
SEA presents the following results :
- Datasets Table of experiments (datasets) that contain samples annotated with the searched term. The table shows dataset-ID along with metadata such as the number of samples in the experiment, tissue, cell line, organism, disease, cell type and a link to Oasis 2 output (analysis results of the raw sequencing data with detailed quality information).
- Intra-dataset comparisons Here the table shows the all intra-dataset comparisons for the experiments in the Datasets table. It displays dataset ID, condition on which the corresponding comparison was performed such as healthy vs diseased, covariates (if any), and links to analysis results of sRNA differential expression, pathogen differential expression and sRNA classification based analysis results.
- miRNA - Disease Associations
This table only appears when searching with a disease ontology term. The table shows disease names, miRNA IDs and associations (publications from where this relation was obtained). All of these values are clickable links corresponding to their sources like the ontology lookup service (OLS) and pubmed. Tabs are shown for each disease that was searched. Since disease terms are connected to ontologies, all subtypes of the searched disease are presented in the table. For example carcinoma, breast cancer and others when searching for the term "cancer". This table has a maximal size of 50 entries (disease - miRNA combinations), therefore some associations might be missing. In order to get more results, a more specific term (e.g. "breast cancer" instead of "cancer") should be searched.

Fig 10.
On the fly analysis
Presented with the search results are options to do further analysis:
- Overlap differential expression or classification results from different datasets.
- Resubmit differential expression or classification of SEA datasets to Oasis 2.
Overlap differential expression or classification results from different datasets
The tables for differential expression results and comparison results provide a checkbox per experiment.
By ticking these checkboxes, the experiment is selected for the SEA overlap analysis.
The SEA overlap analysis, visualizes
the overlap of the top differentially expressed pathogens or sRNAs
between several differential expression analyses and respectively for the top features in sRNA classification.
To do this analysis, users may click the corresponding button underneath the tables (for example "sRNA DE Overlap").
User datasets can be compared with public datasets; however, classification datasets cannot be compared with Differential Expression Compraisons.
The following figure shows an example analysis for four different sets of sRNA being the features for classification of different samples.

Fig 11.
The top line still shows the sRNA and the tissue that was searched, however in this page all sRNA which play role in the selected experiments are shown. The filter section provides fields to adjust the shown results. The minimum AUC of the used model and minimum mean decreased gini score can be set and only the sRNA that have these values in a classification analysis are considered for the overlap. In case of differential expression, users can filter for minimum adjusted-p value, minimum (absolute) log 2 fold change and the direction of regulation. The first table on the page gives an overview of the selected experiments and has the "Set Name" in the first column which identifies the experiment in the other parts of the page. The table on the right shows all entities (in this case sRNA) which play role in at least one of the experiments according to the filter. The second column shows in which sets these sRNAs play a role. The filter functionality of this table might be useful when looking for a specific sRNA or experiment. The plot that is shown on this page is known as UpSet plot. While it may look foreign or complex, UpSet plots are another way of visualizing venn diagrams at larger scales. There are three main components of the UpSet plot: (a) the leftward vertical black bar plot, (b) the upward horizontal blue bar plot, and (c) the indicator grid. To avoid confusion, here "vertical" bar plot refers to the fact that each bar is placed either above of below another, and the bars extend horizontally. Part (a) of the UpSet plot shows the cardinatlity (size) of the set (experiment) i.e. how many elements the set in total contains. Part (b) of the UpSet plot shows how many elements uniquely belong to the indicated region (sRNAs). Part (c) of the UpSet plot identifies the indicated region. The black circles indicate that the bar above it belongs to the corresponding sets to the left. In other words, a column with one black circle means these elements are wholely unique to that set, whereas the column with all black circles are the elements shared by all sets. Thus the indicator grid (part c shows all possible regions of venn diagram corresponding to the four different sets displayed in this example. Clicking on one of the blue bars of part (b) results in the IDs of the sRNAs that are present in all the exeriments of this region displayed. Each sRNA is shown exactly once in this plot. Note, the black bars on the left are not clickable.Comparison details and resubmission to Oasis 2
- Press the green plus button to create a new group.
- Click lasso select button.
- Select samples from the t-SNE plot (Fig 14) by dragging the lasso on the plot.
- Press the green plus again to create a second group.
- Select the second group of samples from the t-SNE.
- Check the groups to ensure they are as desired.
- Press the blue send button (next to green plus button).
- Provide an e-mail adress where the results should be sent once complete.
- Click the submit button.

Fig 12.

Fig 13.

Fig 14.
Uploading one's own data
SEA is a publically available data repository and a webserver and users can use it without an account or login. In case users want to upload and compare their own data to the data in SEA they need to create an account. Users have an option to sign in with their google account or they can register in the SEA system directly with a valid email address, choosing a username and password for their account. We have created User-DB to store their account information as well as sRNA-seq data uploaded by the users. Moreover, user-uploaded data is only accessible from the user’s account. Users have the option to include their data in SEA for 30 days. For the data protection, security, and storage space reasons, we currently do not allow users to add data permanently to SEA.
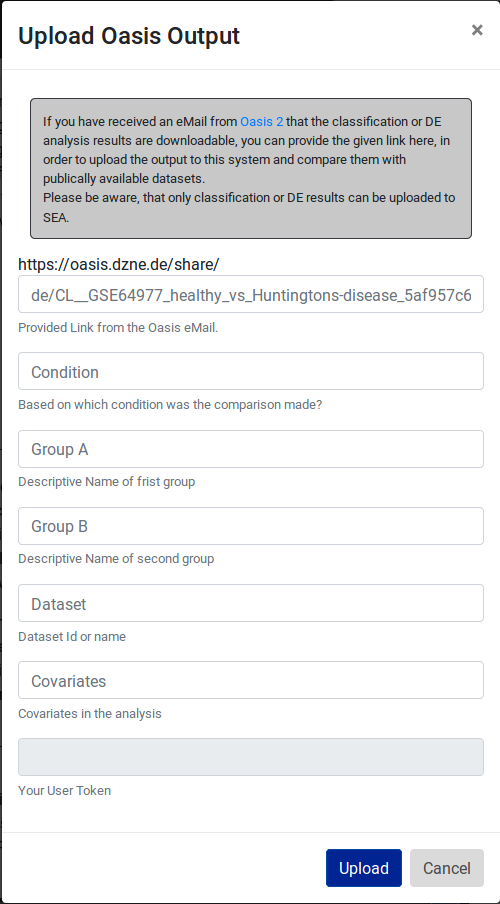
Fig 15.
Versioning of SEA
Release History:
- september 2019: revision for NAR publication: adding of index. Updating user model (inkl. reset of users); renaming SEA officially to SEAweb
- october 2018: SEA moved from sea.dzne.de to sea.ims.bio
- march 2018 : The frontend received a major make over moving from Java Server Pages to Python Django. Several Datatypes were added like Pathogen Differential Expression. Also, several functionalities were added, like Oasis resubmission and overlap of sRNAs and pathogens.
- August 2017: initial publication on https://www.biorxiv.org/content/10.1101/133199v1
Maintenance Plan
In order to keep SEA up to-date with the current small RNA sequencing data or future data that will be published to GEO, SEA automatically searchs GEO and SRA databases once every two weeks (as GEO updates its repository regularly after two weeks). When performing these automatic searches for new data, SEA will download raw fastq files, submit these files to Oasis 2, and assign enqueue these new data in the semi-automatic annotation pipeline for tissue, cell line, cell type and other meta-data available for each of the downloaded samples. Once partially annotated, manual curators ensure accuracy and correct mistakes from the automatic annotation. To facilitate these human-curated annotations, we have developed a friendly user-interface for the curators. Undoubtly, this process of semi-automatic annotation can be imporved. For example, in the case of missing annotation curators must read original articles to provide the annotations which is time-consuming (and possibly human-error prone). To overcome these limitations and keep updates of the new sequencing data more uniform, we are actively exploring the improvements to automatic annotation that can be provided by using deep learning. Preliminary results of these efforts can be found online.
Getting help : Contact us
If you are having questions which we could not answer in this documentation page, do not hesitate to contact us via eMail sea@zmnh.uni-hamburg.de.